Ontario's iGaming Gross Revenue Surpasses $300,000 for the First Time in January 2025


18 March 2025—The Non-adjusted gross gaming revenue recorded over $300K in January 2025 for the first time since the market launch, Casino Rewards Hub reports.
Key Highlights:
- From April 2022 to January 2025, NAGGR had the highest growth at 646.92%.
- Year-on-year growth from January 2024 to January 2025 showed a 30.99% rise in cash wagers and a 35.95% increase in NAGGR.
- In January 2025, cash wagers increased by 0.24%, NAGGR rose by 21.76%, and active players increased by 7.80% compared to December 2024.
- The average revenue per active player account tends to stay between $250 and $300.
Ontario’s iGaming market started in April 2022 and will soon have marked its third anniversary. As more operators have contracted with iGaming Ontario (iGO), the internet gambling regulator of the province, there are now 50 operators and 84 websites available in the market.
According to iGO’s monthly market performance report updated on 19th February 2025, the Non-adjusted gross gaming revenue (NAGGR) recorded over $300,000 (Canadian dollars) in January 2025 for the first time since the market launch.
To gain a deeper understanding of Ontario’s online gambling market, Casino Rewards Hub has performed a growth analysis on key metrics in the iOG's market performance report, focusing on Cash Wager*1, NAGGR*2, Active Player Accounts*3, and ARPPA*4. This analysis involved comparing the most recent statistics with those from the market's inception, the same month in different years, and the previous month.
- Cash Wagers exclude any bets made using promotional bonuses.
- NAGGR, or Non-Adjusted Gross Gaming Revenue, represents the total cash wagered across all operators, including rake, tournament fees, and similar charges. From this figure, only player winnings from cash bets are subtracted, while operating expenses and other costs are not considered.
- Active Player Accounts are those involved in cash or promotional wagers during a given reporting month. These accounts do not necessarily correspond to unique individuals, as one person may hold multiple accounts with different operators.
- ARPPA stands for Average revenue per active player account. It is determined by dividing the total NAGGR by the number of active player accounts within the reporting month.
Market Sees Over 600% Growth in NAGGR Since 2022
From April 2022 to January 2025, internet gambling in Ontario experienced tremendous growth across all key performance indicators—Cash Wagers, NAGGR, and Active Player Accounts. The percentage growth is most pronounced in NAGGR (646.92%), indicating the industry has been incredibly efficient at monetising its activities over the observed period.
Cash Wagers & NAGGR Growth:
| Period | Cash Wagers | Growth ($) | Growth (%) | NAGGR | Growth ($) | Growth (%) |
|---|---|---|---|---|---|---|
| 2025-01 | $7,836,000 | $6,757,000 | 626.23% | $327,900 | $284,000 | 646.92% |
| 2022-04 | $1,079,000 | - | - | $43,900 | - | - |
Active Player Accounts & ARPPA:
| Period | Active Player Accounts | Growth (#) | Growth (%) | ARPPA ($) | Growth ($) | Growth (%) |
|---|---|---|---|---|---|---|
| 2025-01 | 1105 | 828 | 298.92% | $297 | $138 | 87.24% |
| 2022-04 | 277 | - | - | $158 | - | - |
-
Cash Wagers Growth:
The value of wagers placed rose significantly, from $1.079M to $7.836M, representing a massive growth of 626.23%.
-
NAGGR Growth:
Revenue increased from $43,900 to $327,900, resulting in an even higher percentage growth of 646.92% compared to the Cash Wagers growth.
-
Active Player Accounts Growth:
The number of active player accounts increased from 277 to 1,105, a growth of 298.92%.
-
ARPPRA Growth:
The average revenue per active player account rose by 87.24%, nearly amounting to $300.
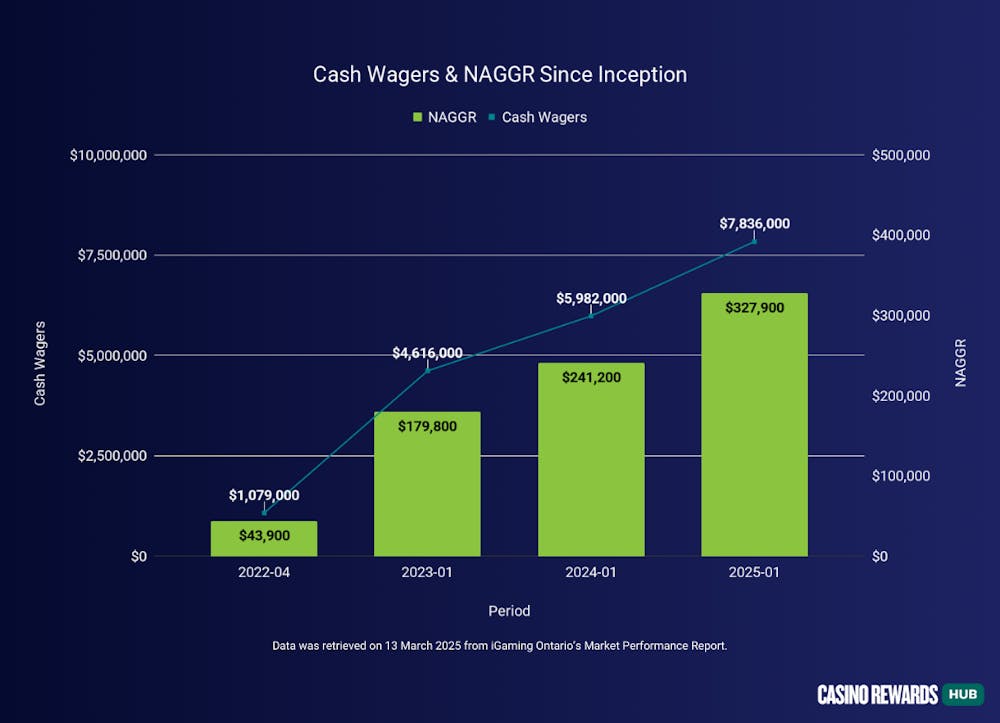
- Cash Wagers & NAGGR Since Inception
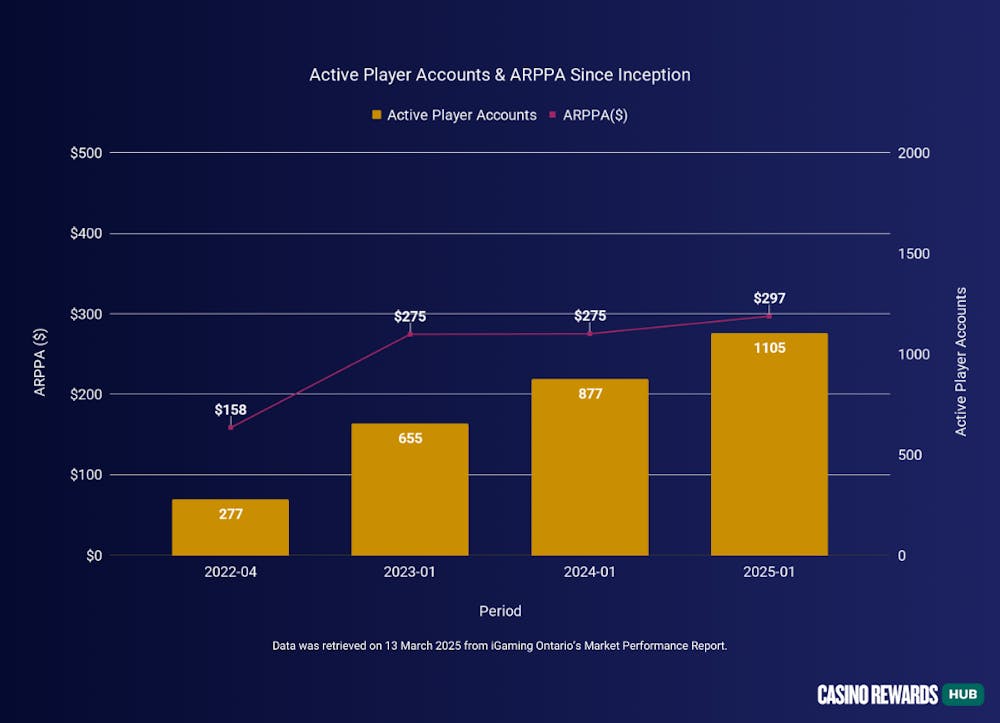
- Active Player Accounts & ARPPA Since Inception
Yearly Market Growth Records 35% Approximately
Cash Wagers and NAGGR show exceptional growth in both dollar terms and percentage terms, indicating strong market performance. While the number of Active Player Accounts continues to grow, its percentage growth slowed slightly in 2025 compared to 2024, suggesting the industry may be reaching higher retention or saturation levels.
Cash Wagers & NAGGR Growth:
| Period | Cash Wagers | Growth ($) | Growth (%) | NAGGR | Growth ($) | Growth (%) |
|---|---|---|---|---|---|---|
| 2025-01 | $7,836,000 | $1,854,000 | 30.99% | $327,900 | $86,700 | 35.95% |
| 2024-01 | $5,982,000 | $1,366,000 | 29.59% | $241,200 | $61,400 | 34.15% |
| 2023-01 | $4,616,000 | - | - | $179,800 | - | - |
Active Player Accounts & ARPPA:
| Period | Active Player Accounts | Growth (#) | Growth (%) | ARPPA ($) | Growth ($) | Growth (%) |
|---|---|---|---|---|---|---|
| 2025-01 | 1105 | 228 | 26.00% | $297 | $22 | 7.90% |
| 2024-01 | 877 | 222 | 33.89% | $275 | $1 | 0.19% |
| 2023-01 | 655 | - | - | $275 | - | - |
Cash Wagers Growth:
- January 2025: Grows by $1,854,000 (+30.99%) compared to January 2024.
- January 2024: Grows by $1,366,000 (+29.59%) compared to January 2023.
Indicates a consistent year-over-year growth in betting activity, though the absolute dollar growth is larger in 2025.
NAGGR Growth:
- January 2025: Grows by $86,700 (+35.95%) compared to January 2024.
- January 2024: Grows by $61,400 (+34.15%) compared to January 2023.
Revenue growth is strong and has accelerated slightly by 2025.
Active Player Accounts Growth:
- January 2025: Increases by 228 accounts (+26.00%) compared to January 2024.
- January 2024: Increases by 222 accounts (+33.89%) compared to January 2023.
Growth in active accounts is steady, though slightly slower in January 2025 compared to the previous year.
ARPPRA Growth:
- January 2025: Increases by $22 (+7.90%) compared to January 2024.
- January 2024: Increases by $1 (+0.19%) compared to January 2023.
The average player revenue’s growth is minimal, implying the industry’s current player value.
Monthly Performance Comparison (January 2025 vs December 2024)
January 2025 saw growth in Ontario's iGaming market compared to December 2024: cash wagers, NAGGR, active player accounts, and ARPPA all increased.
Cash Wagers & NAGGR Growth:
| Period | Cash Wagers | Growth ($) | Growth (%) | NAGGR | Growth ($) | Growth (%) |
|---|---|---|---|---|---|---|
| 2025-01 | $7,836,000 | $19,000 | 0.24% | $327,900 | $58,600 | 21.76% |
| 2024-12 | $7,817,000 | - | - | $269,300 | - | - |
Active Player Accounts & ARPPA:
| Period | Active Player Accounts | Growth (#) | Growth (%) | ARPPA ($) | Growth ($) | Growth (%) |
|---|---|---|---|---|---|---|
| 2025-01 | 1105 | 80 | 7.80% | $297 | $34 | 12.94% |
| 2024-12 | 1025 | - | - | $263 | - | - |
CashWagers:
- January 2025: $7,836,000
- December 2024: $7,817,000
- Growth ($): $19,000
- Growth (%): 0.24%
Between December 2024 and January 2025, CashWagers increased slightly, but the growth percentage was relatively low (0.24%), implying that the overall betting activity was steady between these two months.
NAGGR:
- January 2025: $327,900
- December 2024: $269,300
- Growth ($): $58,600
- Growth (%): 21.76%
The substantial 21.76% growth in NAGGR reflects improved revenue efficiency, possibly driven by strategic changes (e.g., reduced bonus expenses or higher player revenue contributions).
Active Player Accounts:
- January 2025: 1,105 accounts
- December 2024: 1,025 accounts
- Growth (#): 80 accounts
- Growth (%): 7.80%
The 7.80% rise in Active Player Accounts is a positive trend, indicating that more players were active in January compared to December. This can contribute to future growth in both wagering and revenue.
ARPPRA Growth:
- January 2025: $297
- December 2024: $263
- Growth ($): $34
- Growth (%): 12.94%
ARPPRA grew by $34 (12.94%) to $297, nearly reaching the $300 threshold.
Ontario iGaming Market: January 2025 in Review

In conclusion, Ontario’s iGaming market has shown remarkable progress since its launch in 2022, with consistent growth across key performance metrics like Cash Wagers, NAGGR, Active Player Accounts, and ARPPRA.
The latest data from January 2025 highlights a record NAGGR of $327,900, representing a growth of over 646% since the market’s inception, while Cash Wagers and Active Player Accounts continue to rise steadily. The data also shows a stable average revenue per player ranging from $250 to $300.
Despite signs of a slight slowdown in account growth rates, the market’s sustained revenue increases reflect its efficiency, strong player engagement, and effective regulatory oversight.
These trends position Ontario as a leading example in the regulated online gambling industry and underscore the market’s ability to adapt and thrive in a competitive landscape.
Note: The report was retrieved on 13 March 2025 from iGaming Ontario’s Market Performance Report, which includes data updated to January 2025.
For Casino Rewards fans, there are 7 Casino Rewards casinos in Ontario operating fully legally in the jurisdiction.

Yusaku is a Casino Rewards Hub editor who is committed to providing unique and valuable insights. He has been in the iGaming industry since 2020, working in various positions for international online casinos. His experience also includes reviewing and analysing numerous online casinos and betting sites worldwide. This background allows him to understand players' diverse profiles and preferences.